Fact Friday
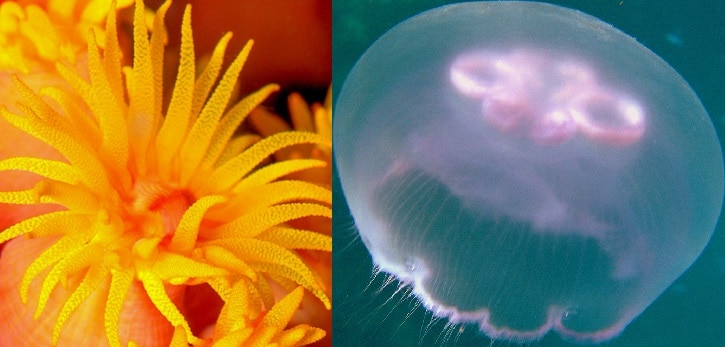
Some cnidarians switch between a polyp and a medusa body form. Corals and anemones only have the polyp stage. Jellyfish, as we think of them, are in the medusa stage, but they have a polyp stage when they are juveniles. Hydrozoans have the opposite: their adult form is a polyp, but they have a juvenile medusa stage.
Photo Credit: KSLOF, Rob Martimbeault


Background Information
Earth’s System
All life on earth is supported by nutrients being recycled repeatedly. In this unit, you will learn about the biogeochemical cycle and how this impacts earth’s biosphere and life-support systems, how matter and energy are transferred in a system, and the feeding connections that sustain the coral reef food web.
Earth is a complex system, a group of independent parts that has a defined boundary. There are four major independent parts on Earth, called spheres, which include the geosphere, hydrosphere, atmosphere, and biosphere (figure 16-1). The geosphere (1) is comprised of the molten rock and solid parts of the Earth. It includes the continental and oceanic crusts (see Bathymetric Features of the Ocean Floor) and all of the layers of Earth’s interior (mantle and inner and outer core). All water and ice that is on the Earth’s surface (e.g., oceans, lakes, rivers, glaciers), underground, and in the atmosphere makes up the hydrosphere (2). The layers of gas that surrounds Earth is called the atmosphere (3), which is mainly made up of nitrogen, oxygen, argon, carbon dioxide, and water vapor. Let’s think back to the ecological levels of organization in Unit 1: Ecology. The final level of organization is the biosphere (4), which contains all Earth’s biomes – all life including people. These four complex spheres are all interconnected. When a change occurs in one sphere, it will likely result in alterations in others. Some of these changes are slow to happen making them difficult to observe, such as ocean acidification, while others, like hurricanes, occur much quicker and the impacts are immediately visible.
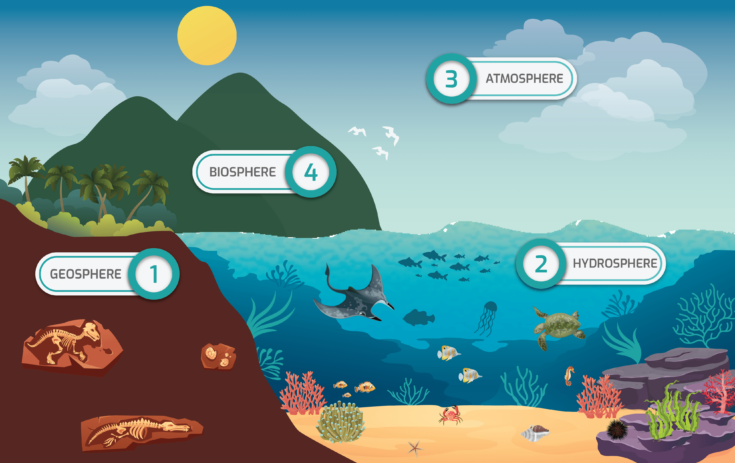
Figure 16-1. Earth’s spheres – 1) Geosphere, 2) Hydrosphere, 3) Atmosphere, and 4) Biosphere.
In order for life to be sustained on Earth, nutrients (matter) must be recycled throughout these spheres. Nutrients include any atom, molecule, or ion that aids an organism in living, growing, and reproducing. Matter constantly cycles through an ecosystem, which is called the biogeochemical cycle (“bio” (life), “geo” (earth), and “chemical” chemical). This cycle is the pathway that matter, or chemical substances, (“chemical”) cycle through the abiotic (“geo”) and biotic (“bio”) parts of an ecosystem. There are many different biogeochemical cycles; however, the main cycles include the water, carbon, nitrogen, and phosphorus cycles. These cycles circulate matter through Earth’s four spheres.
In this unit, you will discover how matter is recycled and energy is transferred in the biotic (living) parts of a coral reef ecosystem. It is important to remember that stable ecosystems have a constant recycling of matter and flow of energy that supports all living organisms. Before beginning this unit, it is suggested that you review the processes of photosynthesis and cellular respiration in Unit 4: Coral Feeding.

Matter
Ecosystems are made up of matter, which is defined as anything that has mass and takes up space. Matter in an ecosystem consists of the abiotic and biotic nutrients. For example, matter in the coral reef ecosystem includes components such as water, carbon dioxide, nitrogen, oxygen, sea turtles, coral, rocks, and salt. When matter passes through an ecosystem, it is not lost. Instead, matter is recycled over and over again.
It may surprise you, but the water that exists on Earth today is the same water that was on Earth over 65 million years ago when dinosaurs were alive. That means that you may be drinking the same water that the dinosaurs drank. How is this possible? According to the Law of Conservation of Mass, matter cannot be created or destroyed. It can only be changed from one form to another. Let’s take a look at the water cycle (figure 16-2). Through different complex processes, water gets recycled over and over again within the Earth and atmosphere. Water (liquid) from oceans, rivers, and lakes heats up and evaporates (gas). This vapor (gas) cools down, becoming heavy, and “precipitates” from the sky in the form of rain (liquid), snow (solid), or hail (solid). Plants also recycle water through a process called transpiration. Their roots absorb water (liquid) from the soil and the stem draws water to their leaves. The water evaporates (gas) from the surface of the leaves. These parts of the water cycle repeat over and over again. The water may have changed from solid, liquid, and gas; however, the hydrogen and oxygen atoms that made up the water molecule were never created or destroyed. That means that the same hydrogen and oxygen atoms that existed 65 million years ago are still present today.
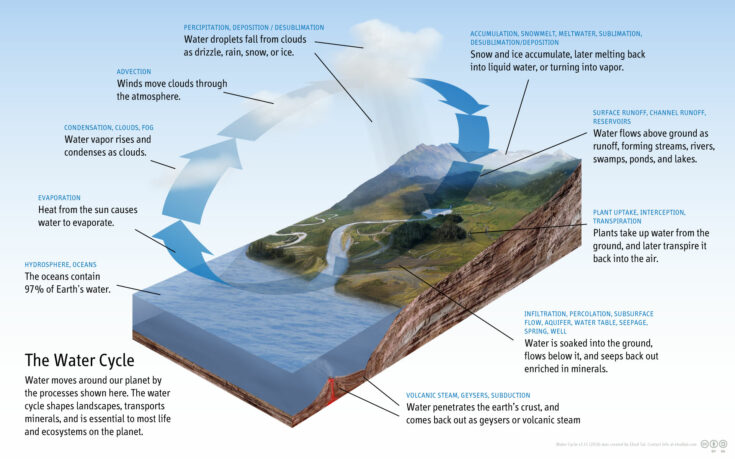
Figure 16-2. Diagram of the water cycle.
Let’s look at another example of how water is conserved during photosynthesis. Figure 16-3 illustrates the molecular and structural formulas that occur during photosynthesis.
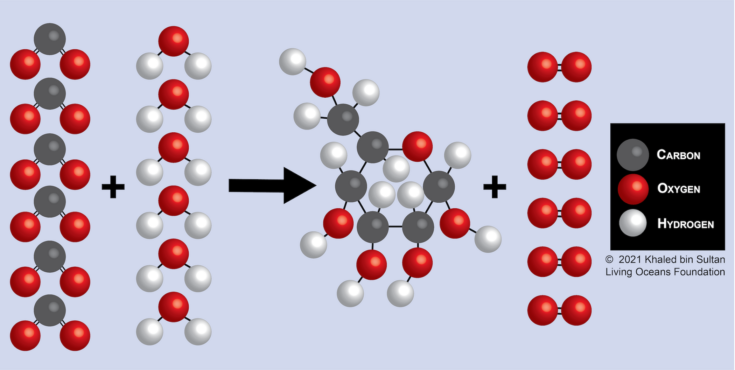
Figure 16-3. Molecular and structural formulas for photosynthesis
Six carbon dioxide molecules (CO2) and six water (H2O) molecules are converted by sunlight (energy) into a sugar molecule (C6H12O6) and six oxygen molecules (O2). Are the same number of atoms present after the chemical reaction takes place?
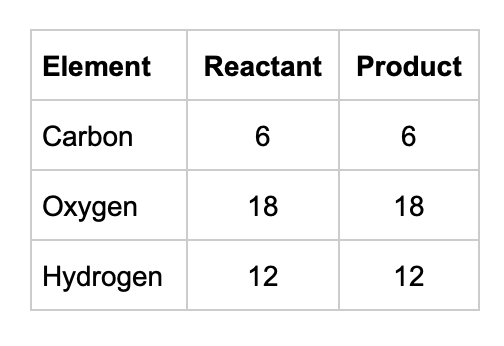
The same number of atoms are present after the chemical reaction occurs. Even though the original carbon dioxide and water molecules have recombined to form sugar and oxygen (changed from one form to another), the same number of atoms are present. Matter is once again conserved.
Matter is not created or destroyed. Atoms, molecules, and ions are cycled over and over again on Earth. They recombine to create different forms of matter, and some can even change states (solid, liquid, and gas). The matter on Earth today was around during the time of dinosaurs and billions of years before that. Some of the atoms in your body may have come from rocks, water, and even dinosaurs.
In other sections of this unit, you will learn more about how matter cycles through ecosystems.

Energy
Watch the video below. What activities are taking place in this video?
You probably observed fish swimming, schooling, feeding, and avoiding predators. Zooxanthellae are photosynthesizing inside the corals (see Unit 4: Coral Feeding). The things that you may not have detected are these organisms’ hearts beating, stomachs digesting food, and the creation of new cells. Each of these organisms requires energy to perform these activities and many more. Whether it is the less obvious processes that require energy, like cells in the body performing vital functions, to the noticeable processes required such as eating, respiring, and moving – every living organism requires energy to carry out basic life processes.
Energy is defined as the ability to do work, or the ability to produce change. Each organism has plenty of “work” to do in order to survive. Where does this energy come from? Like matter, energy isn’t created from nothing. Energy in all ecosystems is subject to the First Law of Thermodynamics, which states energy cannot be created nor destroyed; it can be converted into different forms.
You may be wondering, if organisms do not create energy, how do they obtain it? Organisms obtain energy from the food they produce or consume. Plants use energy from the sun to create food (glucose) through photosynthesis (see Photosynthesis). Some organisms, such as bacteria, produce food (glucose) using chemicals as an energy source through a process called chemosynthesis. Organisms that cannot make their own food through the processes of photosynthesis or chemosynthesis have to eat other organisms in order to obtain glucose. Once glucose is produced or consumed, organisms store it in cells until it is ready to be used. When organisms need energy, they use a process called cellular respiration. Recall from Unit 4: Coral Feeding, that cellular respiration is the process of breaking down glucose to release energy that is stored in the bonds of the molecules. The energy that is released can then be used by the organism for a variety of purposes.
Unlike matter, energy does not cycle over and over again in an ecosystem. Energy flows one-way into and out of an ecosystem. Let’s recap. Energy primarily enters an ecosystem as sunlight and is used by plants to produce glucose through the process of photosynthesis. Glucose can also be produced using the process of chemosynthesis. Organisms that cannot make their own glucose consume other organisms. When energy is needed by an organism, the energy is harnessed by breaking the glucose bond through the process of cellular respiration. Some of that energy then flows to the organism and the rest is lost as heat to the ecosystem. The energy is not “created” by plants. It comes from the sun. The energy is also not “destroyed.” It is stored and used by the organism. Some of the energy is also converted to heat.

Feeding Strategies
Organisms (biotic) are constantly interacting with their physical environment (abiotic) exchanging matter and energy. Let’s take a closer look at the biological or living part of the biogeochemical cycle. Organisms require food (matter) to gain energy. You have learned that they use different strategies to obtain food: photosynthesis, chemosynthesis, and consumption of other organisms. These feeding strategies help categorize how organisms interact in an ecosystem.
Producers
Some organisms create their own food using light or chemical energy. They do not consume other organisms. These organisms are referred to as producers or autotrophs. Autotroph means “self” (auto) “nutrition” (troph).
There are two categories of autotrophs:
- Photoautotrophs use light to create food (figure 16-4). They use chlorophyll or other pigments to photosynthesize (see Unit 4: Coral Feeding).
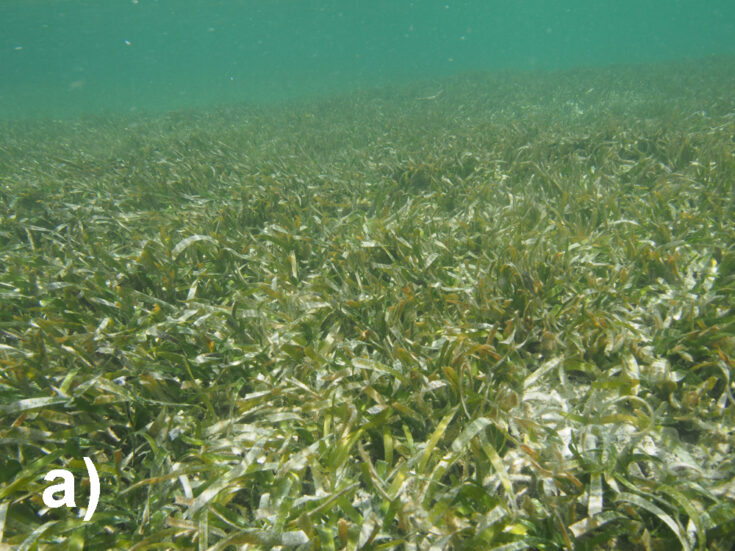
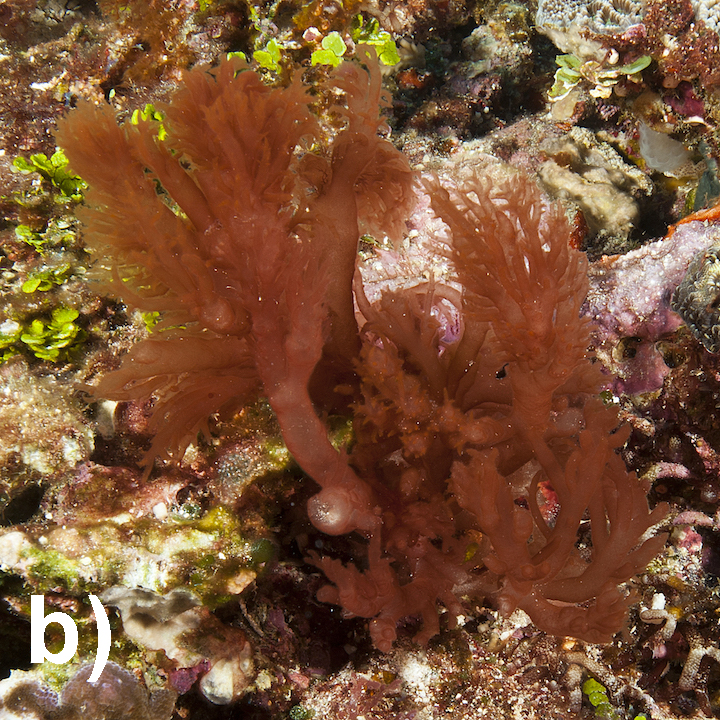
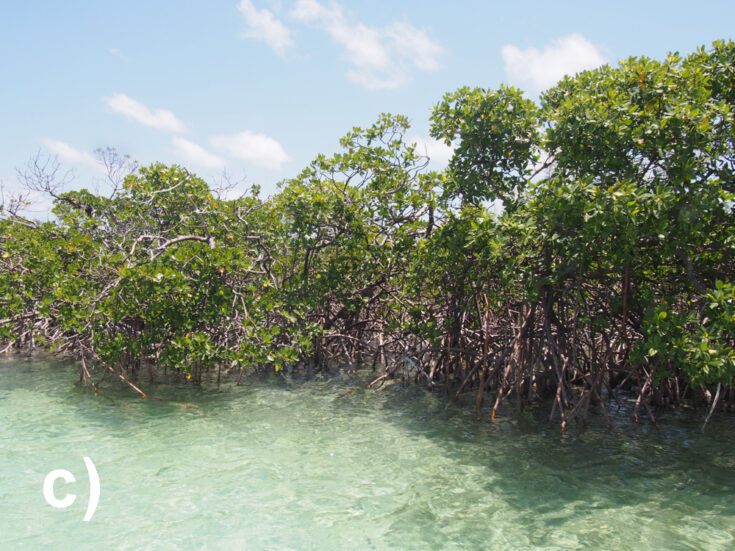
Figure 16-4. The following organisms are photoautotrophs a) seagrass; b) macroalgae; and c) mangroves.
Photo Credit: a) and c) Philip Renaud; b) Ken Marks
- Chemoautotrophs use chemical energy to create food. They include bacteria and archaea. They often use inorganic material (does not consist of both carbon and hydrogen atoms) to create organic compounds (consist of both carbon and hydrogen atoms).
Consumers
Consumers are organisms that cannot create their own food and must eat other organisms in order to survive (figure 16-5). They are also called heterotrophs meaning “other” (hetero) “nutrition” (troph). There are three main categories of consumers:
- Herbivores: an organism that feeds on plants.
- Carnivores: an organism that feeds on other animals.
- Omnivores: an organism that feeds on both plants and animals.
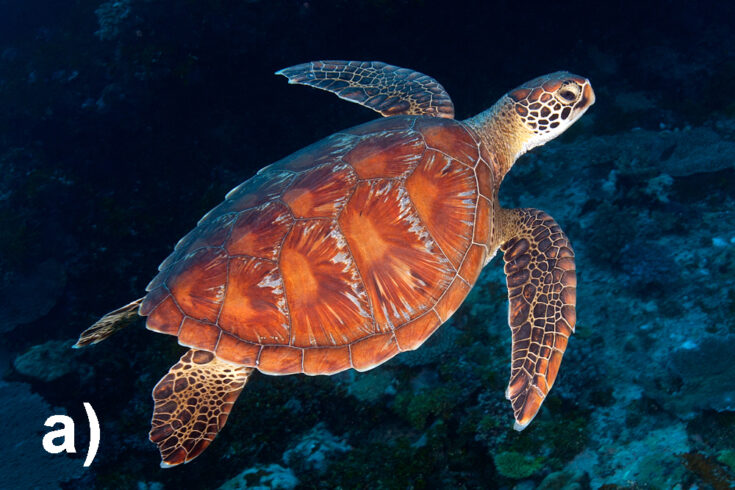
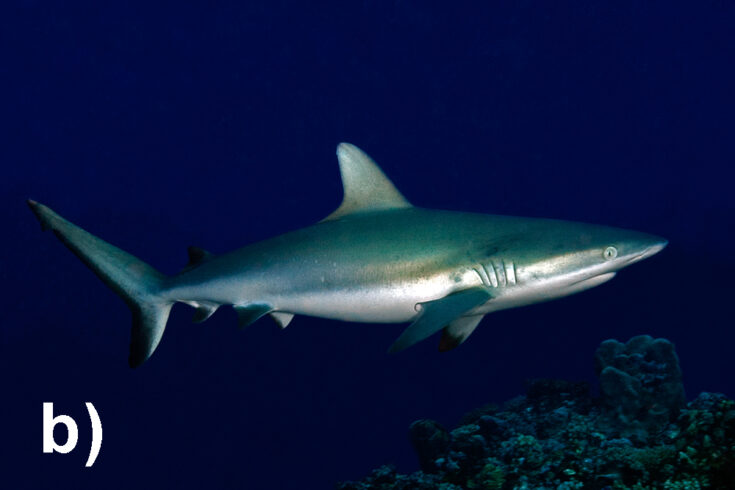
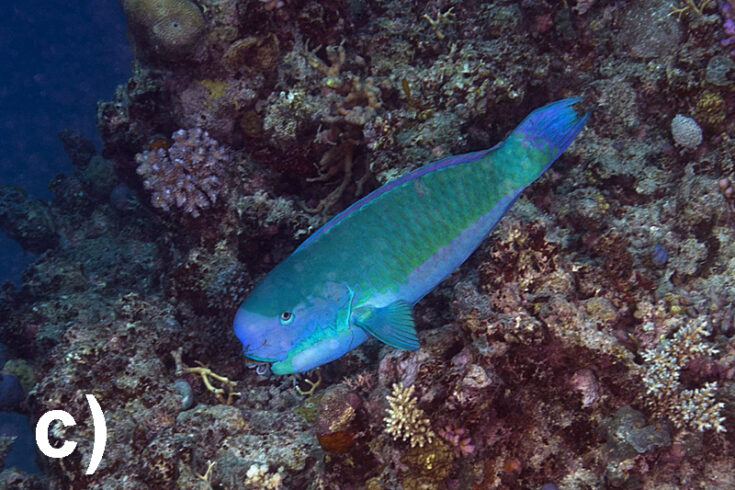
Figure 16-5. The following organisms are examples of the different categories of consumers a) herbivore, green sea turtle; b) carnivore, reef shark; and c) omnivore, parrotfish.
Photo Credit: Ken Marks
Decomposers
Some consumers use a different strategy to obtain food. Decomposers are organisms, such as bacteria and fungi, that break down dead or decaying plants and animals as well as waste. They take organic material and turn it into inorganic nutrients. Decomposers play a critical role in every ecosystem because they make dead organisms and waste consumable to other organisms. Without them, the dead organisms and waste would accumulate and there wouldn’t be enough nutrients recycled to support an entire ecosystem. Detritivores are a type of decomposer (figure 16-6). They consume dead organic material (dead animals and waste) called detritus.
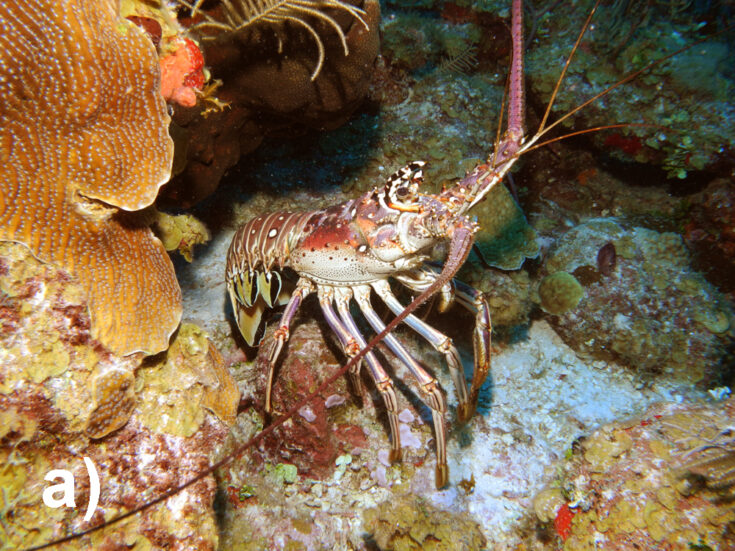
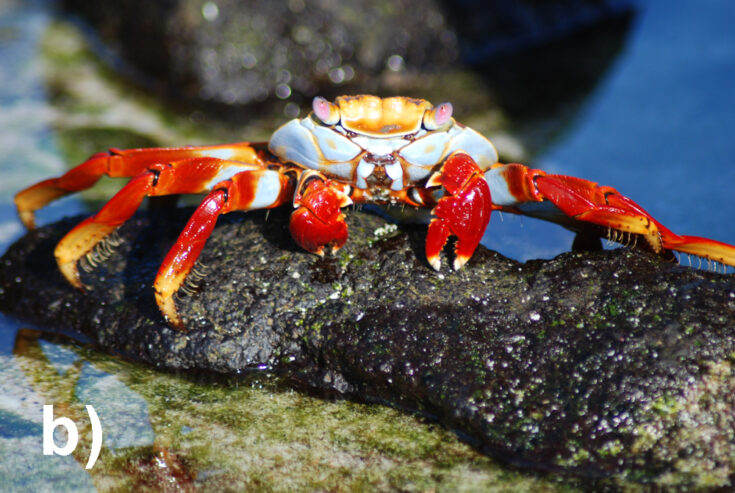
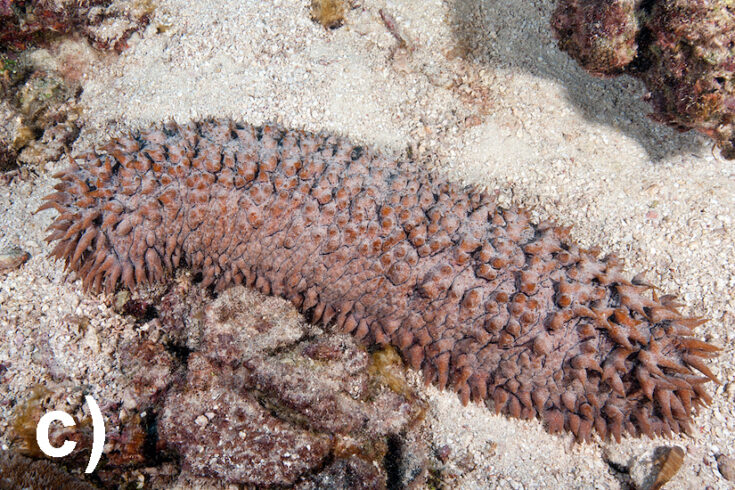
Figure 16-6. The following organisms are examples of detritivores a) lobsters; b) crabs; and c) sea cucumbers.
Photo Credit: a) Andrew Bruckner, b) Alison Barrat, and c) Ken Marks

Food Chain
The primary source of energy in most ecosystems, including coral reefs, is sunlight. Organisms use different feeding strategies to obtain food, which provides energy. Autotrophs harness sunlight to produce their own food, while heterotrophs consume other organisms to acquire energy. One way to represent the feeding connections between organisms, matter cycling, and energy flow through an ecological community is a food chain. This visual depiction shows a series of organisms that eat other organisms. The arrows illustrate the transfer of energy and matter from organism to organism.
Let’s look at an example of a coral reef food chain from the Pacific Ocean (figure 16-7). Phytoplankton is eaten by zooplankton, which is eaten by a butterflyfish that is eaten by an octopus that is finally consumed by a shark. The arrows indicate the matter and energy transferred from one organism to the next. It does not represent what-eats-what. In this example, matter and energy flows from phytoplankton to zooplankton because the zooplankton eats the phytoplankton. Then matter and energy is transferred from the zooplankton to the butterflyfish, and finally the octopus to the shark.
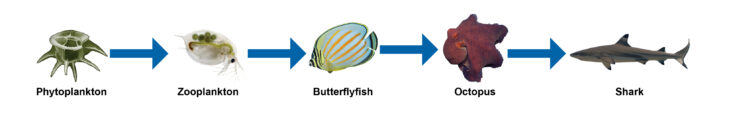
Figure 16-7. Example of a coral reef food chain
Trophic levels can further distinguish the different links in a food chain. These levels describe the hierarchical feeding position in the food chain. They can be distinguished by numbers (1, 2, 3, 4). For example, the first trophic level can be represented by a 1. Below are the different trophic levels in hierarchical order:
- First trophic level: Primary producers are organisms that create their own food using light or chemical energy (autotroph).
- Second trophic level: Primary consumers are organisms in the food chain that feed on autotrophs from the first trophic level. They are usually herbivores (heterotrophs).
- Third trophic level: Secondary consumers are organisms in the food chain that feed on primary consumers. They are typically omnivores or carnivores (heterotrophs).
- Fourth trophic level: Tertiary consumers are organisms that feed on secondary consumers. They are usually carnivores (heterotrophs).
- Fifth trophic level: Quaternary consumers are organisms that feed on tertiary consumers. They are typically carnivores (heterotrophs).
The food chain typically ends with the top predator, also called an apex predator. They have few to no predators and in some ecosystems may help to regulate the food chain.
Assigning organisms to a trophic level is not always straight forward. Some organisms feed from more than one trophic level; therefore, organisms can be classified as having one or more trophic levels.
Using the same example from above, let’s categorize each of these organisms in the food chain with their feeding position or trophic level (figure 16-8).
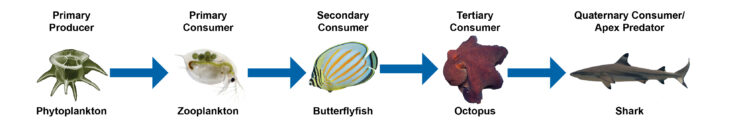
Figure 16-8. Example of a coral reef food chain, which illustrates trophic levels.
- These microscopic phytoplankton or small, plant-like organisms use the sun to photosynthesize, creating their own energy. Therefore, they are primary producers.
- Zooplankton eat phytoplankton. Organisms that eat primary producers are called primary consumers.
- The butterflyfish eat zooplankton, which is a primary consumer. Therefore, the butterflyfish is called a secondary consumer.
- The octopus eats the butterflyfish, which is a secondary consumer. Therefore, the octopus is called a tertiary consumer.
- Finally, the shark eats the octopus, which is a tertiary consumer. Sharks are quaternary consumers. They are also at the top of the food chain, and they are believed to regulate it. Therefore, they are also considered apex predators.
Trophic levels also help to identify how many transfers of matter and energy separate an organism from the original source of energy. For example, in Figure 16-8 the sun is the source of energy, and the butterflyfish is three steps away from it. That means that energy and matter have been transferred three times prior to being consumed by the butterflyfish.

Food Web
Food chains are informative; however, they do not show all feeding connections. Ecosystems are complex. Organisms can eat multiple types of prey and/or can be eaten by different predators. A series of food chains, called a food web, is used to show the interconnectedness of all organisms in an ecosystem. Food webs represent the feeding connections between organisms and models how stored matter and energy is transferred to the organism that consumes it. Like a food chain, the arrows represent the transfer of energy and matter from one organism to the next, but it does not represent what-eats-what.
Let’s take a closer look at Figure 16-9. How many food chains can you create?
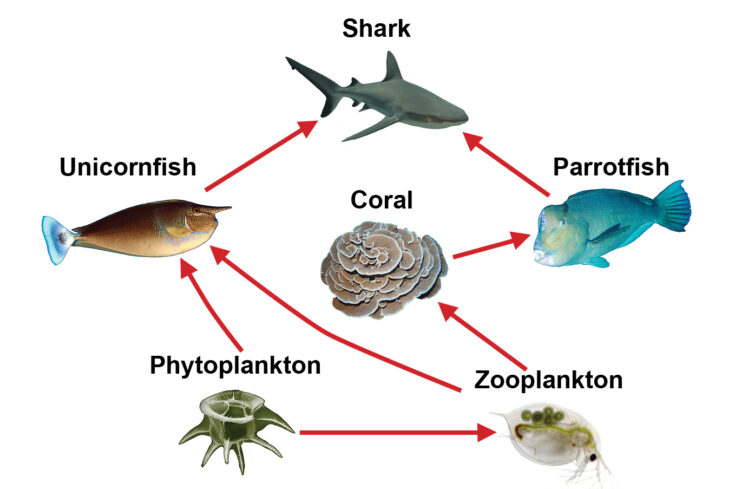
Figure 16-9. The diagram illustrates a simple coral reef food web.
Three food chains can be constructed from the food web in Figure 16-9. What do you notice about these food chains (figure 16-10)? Observe that each food chain begins with phytoplankton, which is a primary producer and ends with an apex predator, the shark. Organisms can consume multiple types of prey from different trophic levels. For example, unicornfish eat both phytoplankton (primary producer) and zooplankton (primary consumer).
Each food chain has varying numbers of organisms. In a later section in this unit, you will learn that it is rare that a food chain will have more than five organisms in it.
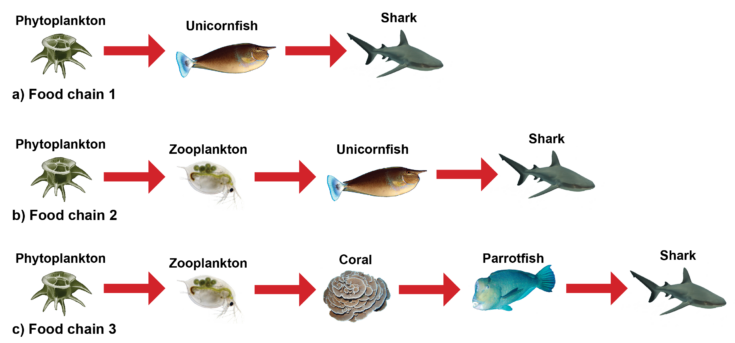
Figure 16-10. Three food chains (a-c) can be created from the food web represented in Figure 16-9.
Food webs are important because they show the direct relationships between organisms; however, they also illustrate the indirect relationships that organisms have with each other. Let’s look at an example from the Figure 16-9 food web. Sharks prey on parrotfish. This an example of a direct relationship because one organism (shark) has an impact on another (parrotfish) without any interactions from other organisms. What happens when we remove sharks from this food web? Because sharks help to regulate the number of parrotfish in the ecosystem, the parrotfish population could explode. In this food web, they have no other predators, and the removal of sharks can indirectly affect other organisms living in this ecosystem. In an indirect relationship, one organism (shark) has an impact on another organism (coral) that is mediated by a third organism (parrotfish). Without sharks, there will be an increased number of parrotfish, which, in turn, will consume more corals. Corals, although not consumed by sharks, are indirectly linked to them.
Some changes in a food web can be insignificant and have little impact; however, some changes are substantial enough to become harmful and change the dynamics of an ecosystem. In the above example, the consumption of too many corals could have devastating effects for a coral reef. As you learned in Unit 9: Coral Growth, stony corals create calcium carbonate skeletons that form the hard substrate of a coral reef. These stony structures provide habitat, food, and shelter for many reef organisms. Too few corals can cause major disruptions, which can be harmful for the corals and other organisms living on the reef. Continuing with this example, you may be thinking that with a reduction in corals, the zooplankton populations would increase; however, this is not the case. Corals consume zooplankton, but it is not their main source of food. Recall from Unit 4: Coral Feeding, that corals receive up to 95% of their food from zooxanthellae. Corals do not regulate the population size of zooplankton; therefore, small increases in their population will have little impact on the food web.

Ecological Pyramids
The food web provides valuable information about an ecosystem; however, it does not display all information such as where the primary source of energy originates, and the amount of energy lost. Decomposers are often not represented either. There are different graphical representations that provide additional information about a food web. One is called an ecological pyramid or trophic pyramid. These pyramids can represent different types of information such as the number of organisms, biomass, and energy at each trophic level in an ecosystem.
Pyramid of Numbers
A pyramid of numbers represents the number of organisms within a given area (figure 16-11). The bars of each pyramid represent the different trophic levels. Typically, the bottom bar starts with the primary producers and each bar moving up the pyramid reveals the next trophic level. The vertical bars are the same height; however, notice that traveling up the pyramid the width of each bar gets smaller than the one before it. In a numbers pyramid, the width represents the number of organisms. The longer the bar indicates that there are more organisms in that trophic level. This type of pyramid also typically includes the number of organisms in an area within a particular trophic level. The units for the number of organisms is typically in “m2,” or “1 meter x 1 meter.” For example, P=125/m2 means that there are 125 primary producers in a 1 meter by 1 meter area.
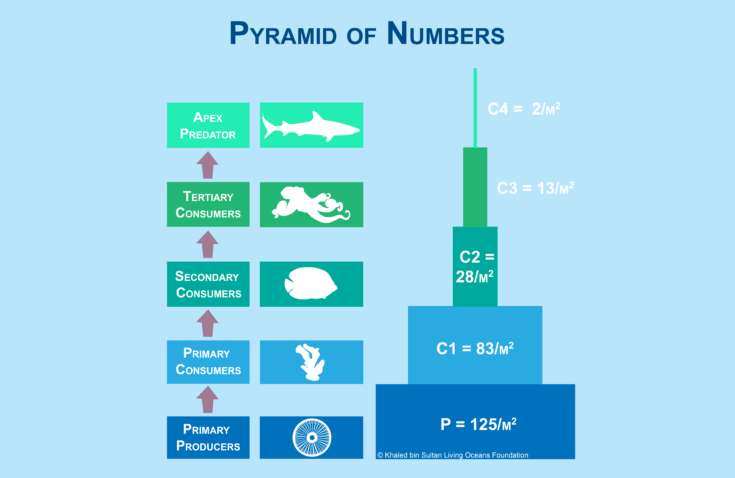
Figure 16-11. A pyramid by numbers represents the number of organisms at each tropic level in a defined area.
Biomass Pyramid
A pyramid of numbers does not consider the size of the organism; however, a biomass pyramid does. A biomass pyramid is a graphical depiction of the total mass of organisms within a given area, and each bar in the pyramid represents different trophic levels (figure 16-12). The biomass is calculated by taking the average mass of a species and multiplying it by the number of organisms in a defined area. For each trophic level, the biomass of each species is added together. The biomass pyramid is a better representation of the amount of energy available at each trophic level, than the pyramid by numbers.
Like a pyramid by numbers, the vertical bars are the same height, but the width of the bars represents the amount of biomass. The amount of biomass is also typically included inside or next to bar. The units for a biomass are typically in “g/m2” or “kg/m2.” For example, C1 = 596 g/m2 means that there are 596 grams of primary consumers in a 1 meter by 1 meter area.
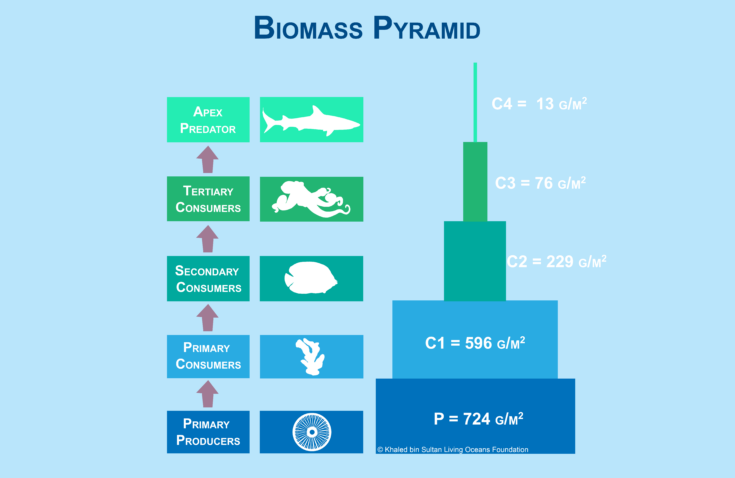
Figure 16-12. A biomass pyramid represents the total mass of organisms at each tropic level in a defined area.

Energy Pyramid & the 10% Rule
The diagram in Figure 16-13 is an energy pyramid, which is a graphical representation of the amount of energy transferred to each trophic level. This pyramid is slightly different than the pyramid of numbers and biomass pyramid. Notice that the sun, decomposers, and heat loss are included in the diagram. The arrows in all parts of this diagram represent energy transfer. The arrow from the sun to primary producers shows how energy is being transferred. Decomposers are not a part of the pyramid because each trophic level passes energy on to them when organisms die and produce waste. Therefore, arrows from each trophic level are draw to the decomposers, which are represented as a circle outside of the pyramid as in Figure 16-13. Some pyramids, like this one, show the heat energy lost to the system. You will learn more about that in a moment.
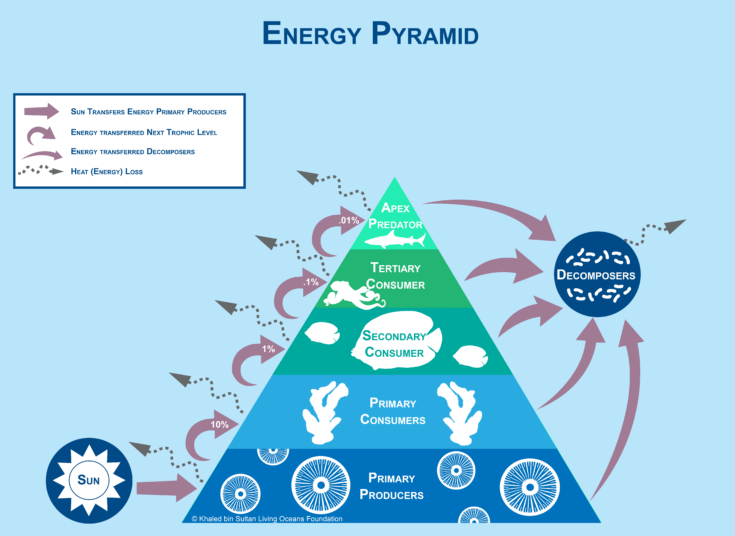
Figure 16-13. An energy pyramid represents the amount of energy that is transferred to each trophic level.
Like other pyramids, the bars represent the different trophic levels. Unlike the others, the bars in this pyramid are all of proportional length and do not represent the specific amount of energy present at each trophic level. The percentages in each trophic level represents the approximate amount of energy that passes on to each level. This is known as “the 10% rule.” Energy is passed from level to level in the trophic pyramid. The amount of energy that is passed on varies. In general, only 10% of the energy gained is passed on to each level. The other 90% is lost, but where does it go? Energy may be used for growth, respiration, digestion, excretion, and moving. Energy is also lost in the form of heat.
To better understand the 10% rule, let’s look at an example.
- Phytoplankton begins with 100% energy from the sun, but it will use 90% of this energy for growth, respiration, and other processes.
- When a zooplankton consumes a phytoplankton, only 10% of that energy will be passed along, which is 10% of the original energy. The zooplankton will use 90% of the energy from the phytoplankton.
- When a zooplankton is consumed by a butterflyfish only 10% of that energy is passed along, which is only 1% of the original energy. The butterflyfish will use 90% of this energy.
- The butterflyfish is then consumed by the octopus, receiving only 10% of that energy, which is only 0.1% of the original energy. The octopus uses 90% of this energy.
- The octopus is then consumed by a shark, receiving only 10% of that energy, which is only 0.01% of the original energy.
The energy decreases from the bottom of the food pyramid to the top. The organisms at the top trophic levels receive very little energy from the original energy passed through each trophic level. That is why there are typically more producers than consumers because there must be enough food available at the lower levels in the food chain (producers) to support the consumers in the higher levels. This is also generally why food chains rarely have more than four or five trophic levels. At the fifth trophic level (quaternary consumers), there would only be .01% of the original energy available.
It’s important to note that are different ways to represent energy pyramids. This is just one type of representation. Other energy pyramids may show the actual amount of energy passed from level to level, similar to the way that information is displayed on a pyramid by numbers and biomass pyramid. The amount of energy is displayed next to each trophic level with the appropriate energy units.
In other units, you will learn how disturbances can affect the coral reef food web and other ecosystems.

Attributions
Figure 16-1.
- Select vectors used from tropical island illustration by macrovector_official via Freepik. https://www.freepik.com/free-vector/tropical-island-illustration_4623644.htm#page=1&query=tropical%20island%20illustration&position=0&from_view=search.
- Select vectors used from sea life constructor by macrovector via Freepik. https://www.freepik.com/free-vector/sea-life-constructor-isolated-icons-set_4265870.htm#page=1&query=underwater%20constructor&position=16&from_view=search.
- Select vectors used from under the sea background for conferencing illustration vector by pikisuperstar via Freepik. https://www.freepik.com/free-vector/sea-background-video-conferencing_9470396.htm#page=1&query=sea%20background&position=0&from_view=search.
- Select vectors used from organic flat world oceans day illustration vector by Freepik. https://www.freepik.com/free-vector/organic-flat-world-oceans-day-illustration_13559200.htm#page=1&query=ocean&position=39&from_view=search.
- Select vectors used from collection of infographic banners by Freepik. https://www.freepik.com/free-vector/collection-infographic-banners_819954.htm#page=1&query=diagram%20label&position=5&from_view=search.
Figure 16-2. The Water Cycle by Ehud Tal (CC BY-SA 4.0 [https://creativecommons.org/licenses/by-sa/4.0)], 27 February 2016 via Wikimedia Commons. https://commons.wikimedia.org/wiki/File:Diagram_of_the_Water_Cycle.jpg.
Figures 16-7 – 16-10. Plankton by Gustaav Hallegraeff, Emeritus Professor, University of Tasmania. www.imas.utas.edu.au.
Figures 16-7 – 16-10. Zooplankton by Dieter Ebert, Basel, Switzerland (CC BY-SA 4.0 [https://creativecommons.org/licenses/by-sa/4.0/)] 19 May 2009 via Wikimedia Commons. https://commons.wikimedia.org/wiki/File:Daphnia_magna_with_Hamiltosporidium_magnivora.JPG.
Grant Acknowledgement
The background information and vocabulary for this unit was assisted (in part) by the Jerome S. and Grace H. Murray Foundation. We are grateful for their continued support of our efforts to advance ocean literacy.
